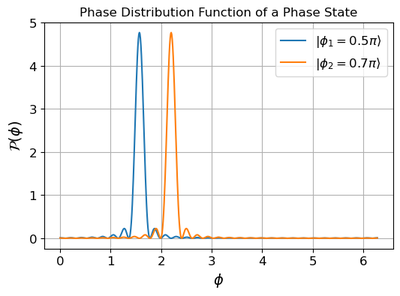
Phase States
The plot of the phase states.
import matplotlib
import matplotlib.pyplot as plt
import numpy as np
# Data for plotting
phi1 = 0.5 * np.pi
phi2 = 0.7 * np.pi
Nmax = 30
phi = np.arange(0.0, 2.0 * np.pi, 0.01)
# define the phase distribution function
def phase_dist_func(x,y):
    return np.sin(Nmax*(x-y)/2)**2./np.sin((x-y)/2)**2/Nmax/(2*np.pi)
phase_dist_1 = phase_dist_func(phi,phi1)
phase_dist_2 = phase_dist_func(phi,phi2)
## plot
fig, ax = plt.subplots()
ax.plot(phi, phase_dist_1,label=r'$|\phi_1=0.5\pi\rangle$')
## r: raw string
ax.plot(phi, phase_dist_2,label=r'$|\phi_2=0.7\pi\rangle$')
## r: raw string
ax.set(xlabel='$\phi$ ', ylabel='$\mathcal{P}(\phi)$',
       title='Phase Distribution Function of a Phase State')
ax.grid()
plt.legend()
fig.savefig("phase_dist.png", dpi=300,facecolor='white', transparent=False)
plt.show()